UX Index for Serasa Experian B2B
The company needed a way to measure and ensure the quality of the customer experience proactively, even before the product release and a McKinsey report were the reference to make it happen.
Context
The project emerged from a strategic need to highlight and measure the company's UX Maturity: how to indicate we have the right people in the right projects and to understand the impact of activities related to the evolution of B2B Design teams.
The A-HA moment
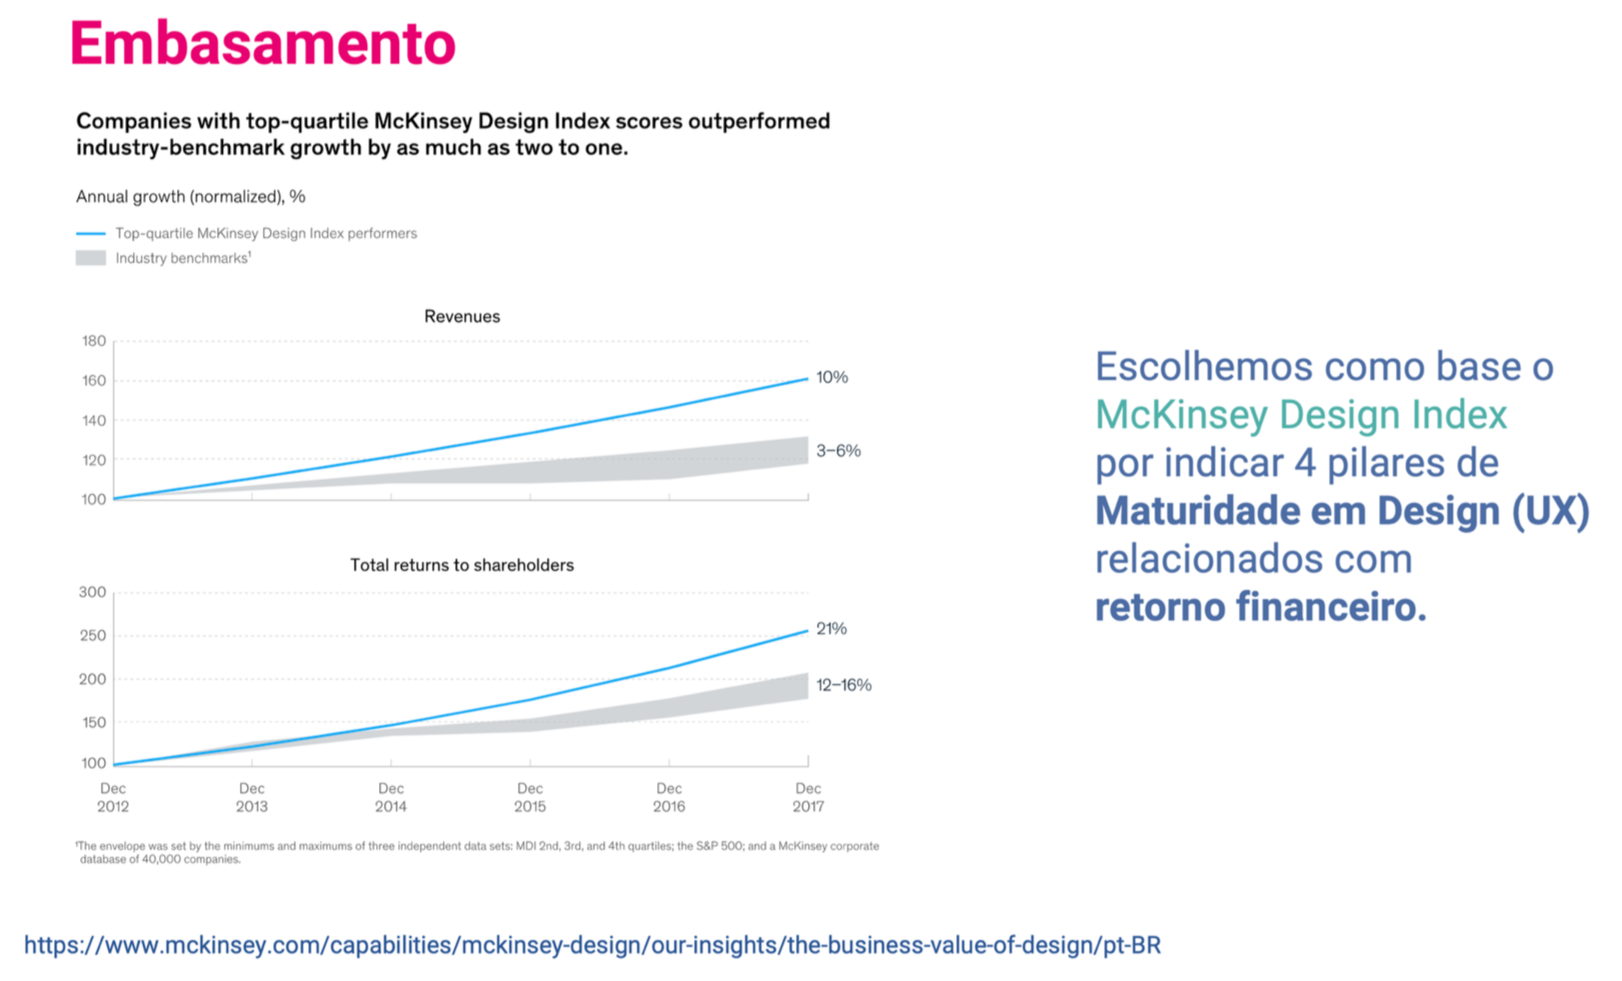
The team researched online materials and chose to use the McKinsey Design Index (MDI) as a reference, adapting its four pillars (Analytical Leadership, Cross-Functional Talent, Continuous Iteration, and User Experience) to the company's context.
Why it was done: The MDI was chosen because it is a validated market index that correlates design maturity with financial return (revenue), giving strategic weight to the indicator.
To talk about user and client exeprience, the company was already using CSAT. However, this indicator acted merely as a reactive "thermometer": it only showed that the experience was bad after the customer had already gone through it. Additionally, there was a latent difficulty in conducting direct research with the B2B audience, which was the primary focus.
So, the MDI gave us a way to measure and ensure the quality of the customer experience proactively, even before the product release, without relying exclusively on direct surveys with end customers or the mandatory presence of a designer in all teams.
Since MDI showed that a great experience is responsability of the whole company and not just from a area or team, we undesrtood we should focus on the goal to increase the company's ability (and not just the designer's ability in isolation) to deliver a good experience.
Main Actions and Activities
To structure the UX Index, the following approaches and methods were used:
Definition of metrics and indicators (creation of the evaluation model based on heuristics)
Experimentation / Pilot (controlled application of the model in selected teams)
Data analysis (cross-referencing UX Index data with CSAT)
Interviews and alignments with stakeholders (leadership and participating teams)
Diagnosis and Feedback / Devolutivas (creation of reports with recommendations for improvements)
Process rational
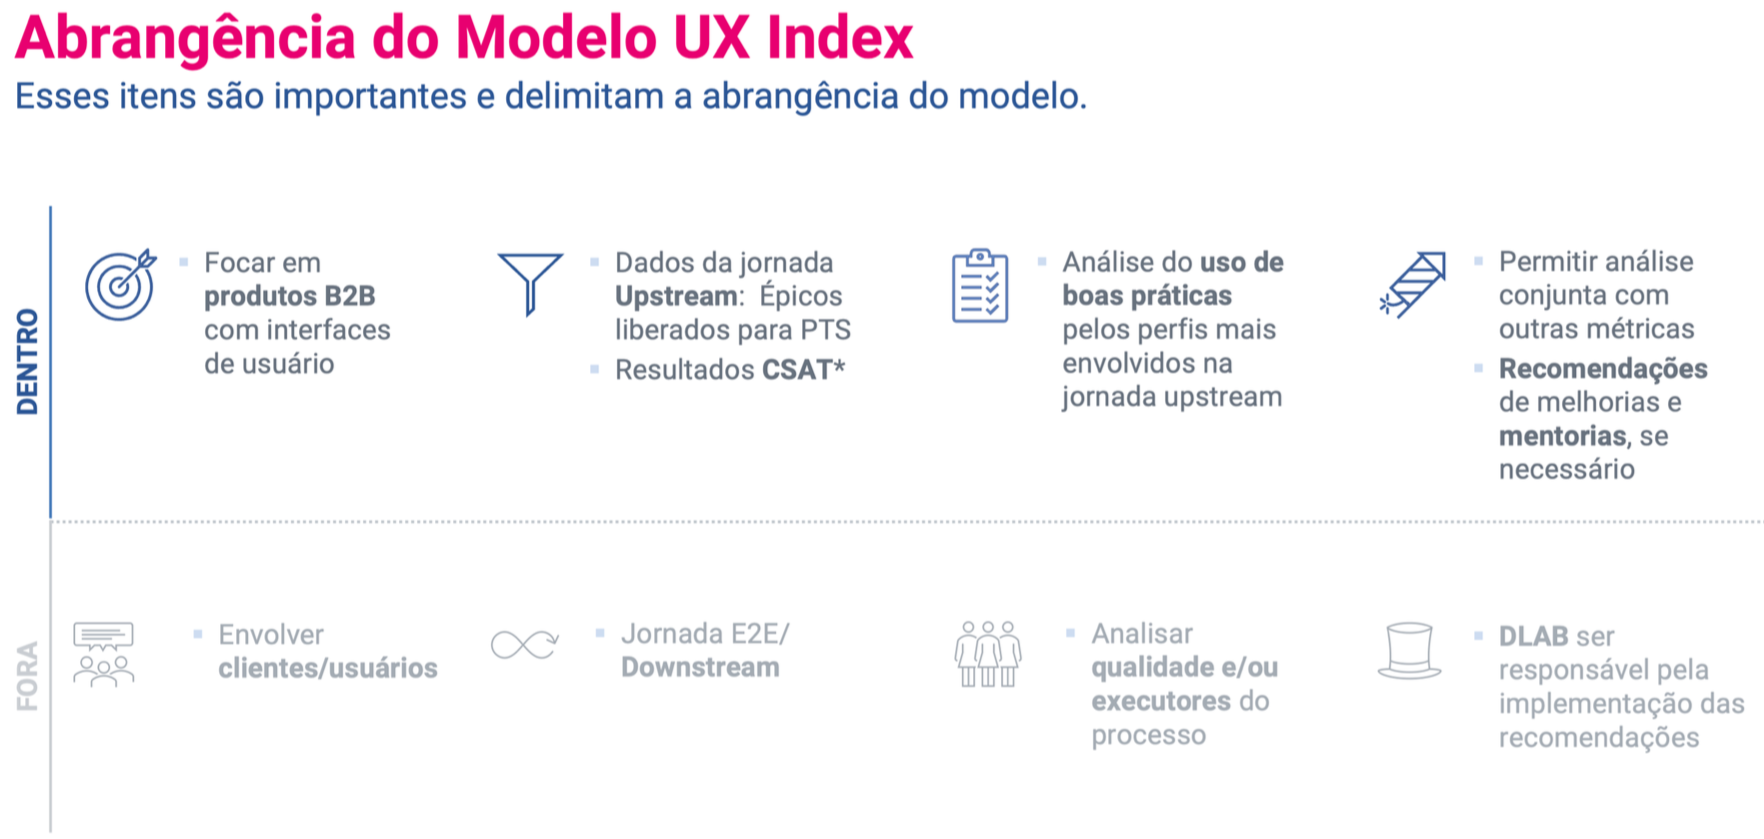
The process was structured to create a new indicator that would coexist with CSAT, evaluating the product lifecycle (upstream and downstream).
1. Evaluation Model Structuring
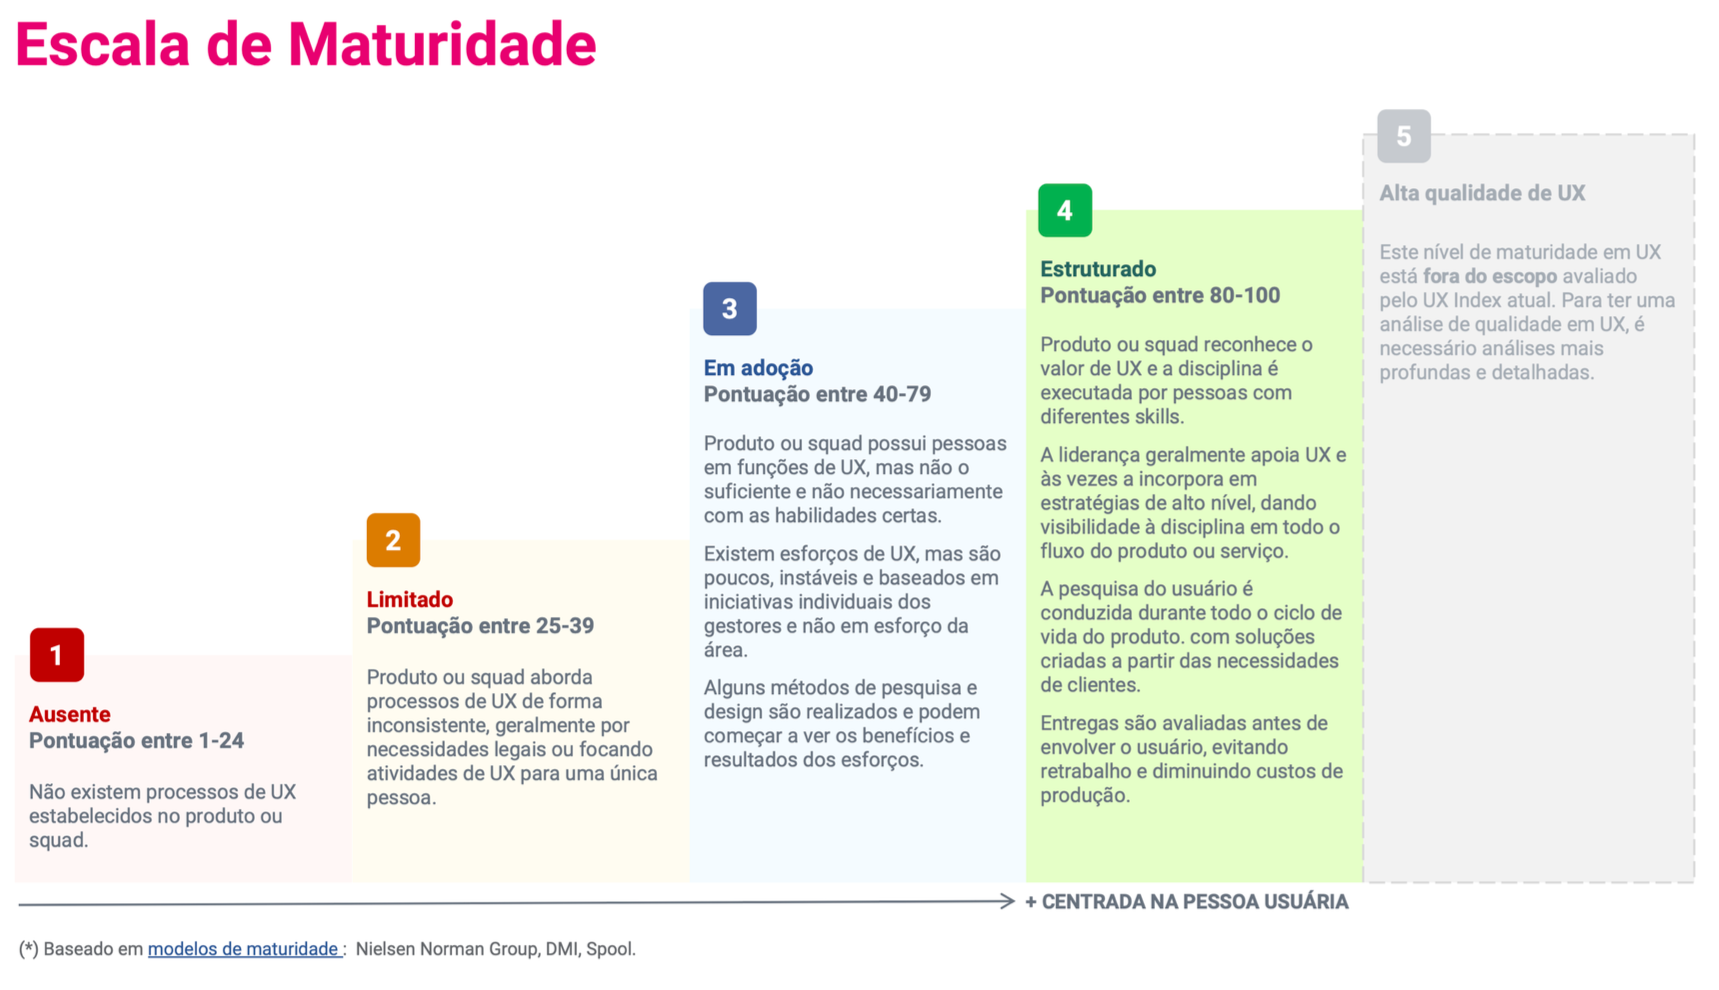
The McKinsey pillars were made tangible into objective questions (answered with yes/no or scales) organized in a form (via Excel and Jira). A maturity scale was created with four levels: Absent (1-24), Limited (25-39), In adoption (40-79), and Structured (80-100). It was necessary to standardize the evaluation so that it covered the whole team (engineering, product, etc.) and not just the designer's work, allowing the team to predict problems through heuristics before triggering the customer. We had also a strong work understanding the team agile process, in a way to find points and internal data that could make it possible to performe evaluation.
2.Pilot Execution
The model was tested in 3 B2B squads (PME Digital, Tech4Corp, and Datalab). The pilot journey included: Triage, Onboarding, Analysis, and Feedback. The selection criteria sought teams with "extreme" CSAT scores (very high and very low). The propose here was to validate or invalidate the project's central hypothesis: to verify if a high UX Index actually reflected a high CSAT at the final delivery.
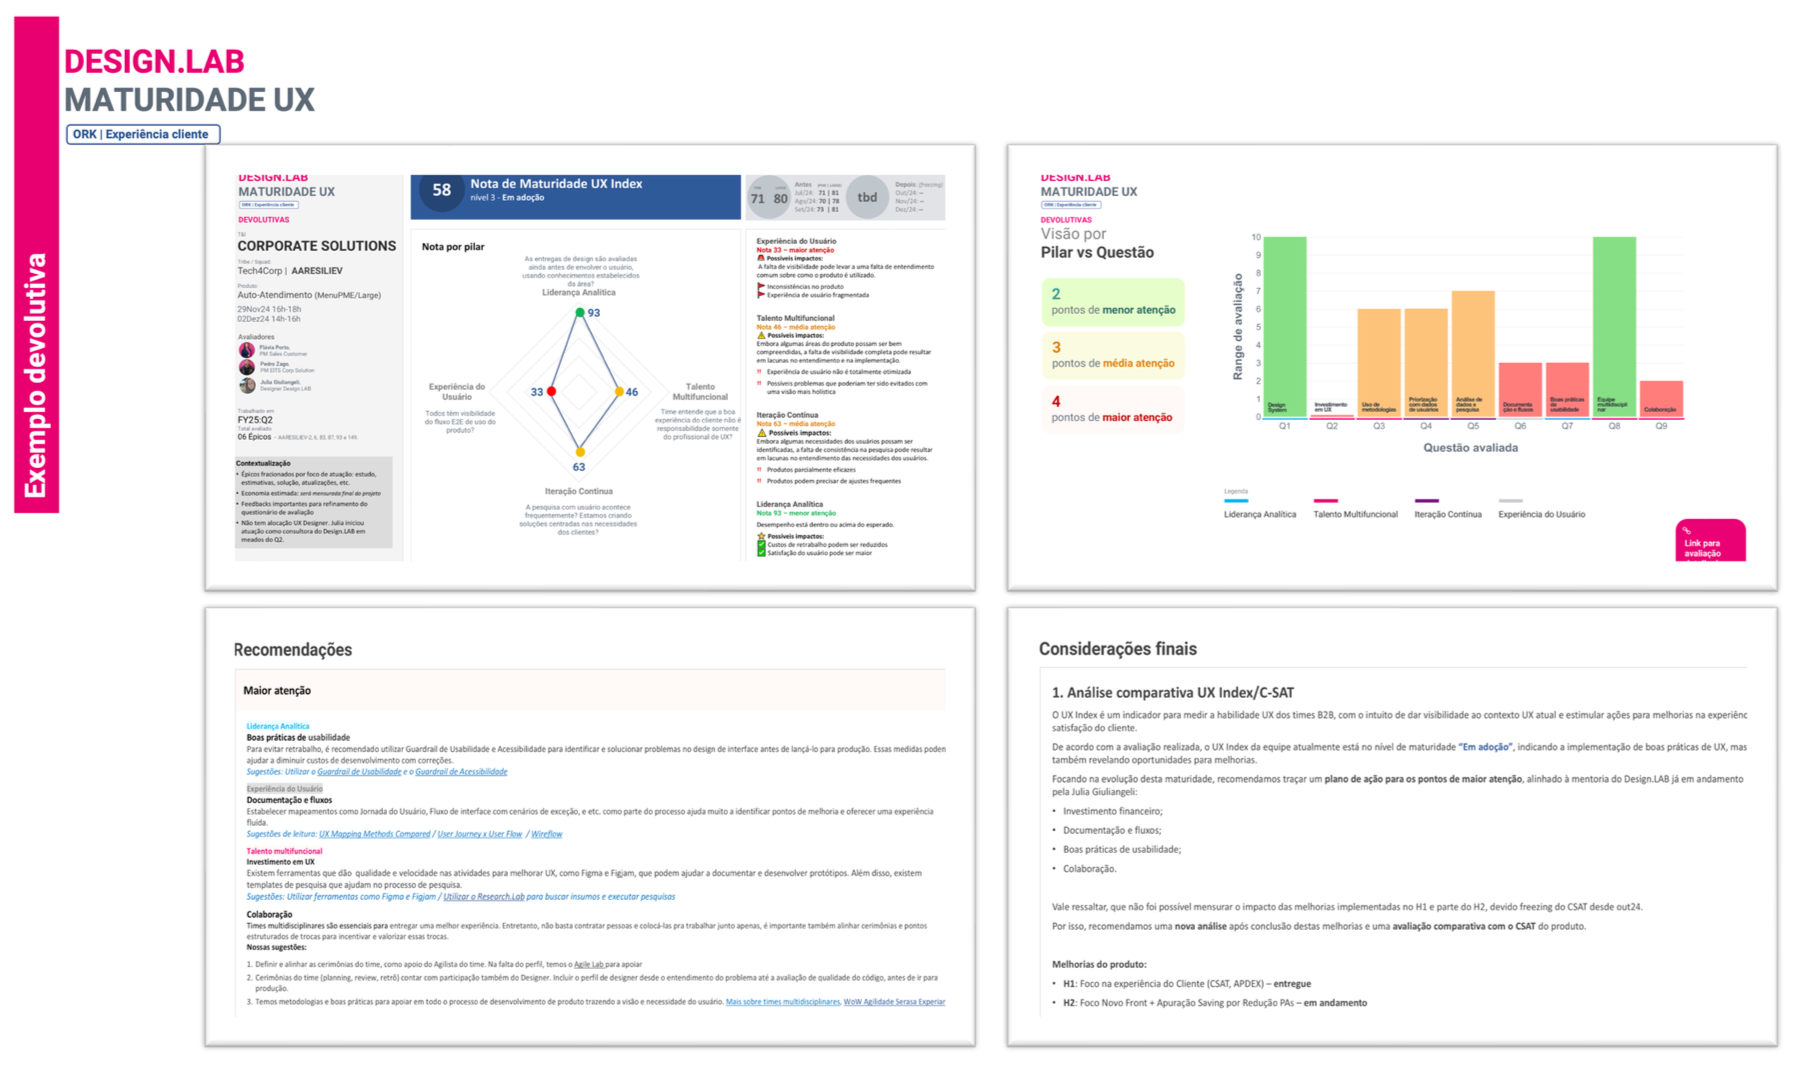
3.Diagnosis and Feedback
The evaluated teams received a diagnosis pointing out which pillars had room for improvement and a suggested action plan. So that the model was not just punitive or evaluative, but acted as a continuous improvement tool for teams to scale their maturity.
Results
Business Correlation (Inconclusive): The main hypothesis that products with a higher UX Index present better CSAT results was considered inconclusive due to internal circusntances. The impact could not be properly measured due to a "freezing" of the CSAT or the lack of prior implementation of the metric in the products evaluated during the pilot.
Pilot Maturity Metrics: Out of the 3 selected products, 2 were classified at the "In adoption" level and 1 at the "Structured" level. The analysis time took from 3 to 6 hours per product, with feedback sessions occurring between 30 and 60 days.
Learnings and Points of Attention: The process successfully mapped 4 major bottlenecks (points of greatest attention) in the evaluated teams: UX Investment, Documentation and flows, Good usability practices, and Collaboration. The project also proved to be viable for teams that did not have fully allocated designers.
Feedbacks: The teams that received the diagnosis reported very positive feedbacks, considering the insights useful and relevant. Other design leaders saw the UX Index as a strong tool to enable the discipline's work within the company.
Strategic Unfoldings: Although the original project did not scale to the entire company as initially planned due to management and board changes, the model was adapted and continued to be used with a directed focus on internal systems and infrastructure/data areas.
Collaboration and stakeholders
The project was built in a multidisciplinary way, with Designers, Service Designers and Proccess Analysts working toghethers. Also we had agilists being consulted and strong executive support.
The Evaluated Teams (Pilot) were composed by Product Managers (PMs), Product Owners (POs), Designers, Developers, Data Professionals (Data analysis), and Customer Success professionals. It was documented that some of these teams had very varied backgrounds and, in some cases, there was no dedicated designer in the squad.
Dedicated Team
This project were possible because of the guidance of Oliver Bhruel, ownership of Lilian Souza, and the effort of Gabriel Dantas and Tainá Fabro.