PicPay Strategy Research


Establishment of a strategic UX Research hub focused on high-impact studies that directly informed business decisions. Partnered with Analytics, Strategy, and Customer Lifecycle teams.


The challenge

The project was born out of a need of positioning a research central team to have a cross-functional approach. Previously, research might have been focused to more business units goals, but the company needed a broader, more strategic view of customer behavior that could serve multiple teams simultaneously.

The initiation of this project was primarily driven by a strategic change and a business opportunity:

  • Strategic Change: The company was going through a massive internal discussion regarding the balance of its EBIT (Earnings Before Interest and Taxes). There was an urgent strategic shift focused on reducing operational costs while simultaneously increasing the profitability and revenue generated by existing products.

  • Business Opportunity: PicPay needed to establish a unified definition of "principality" (what makes a customer choose PicPay as their main bank) and understand how different income clusters related to the brand in order to foster long-term loyalty and offer the right credit products.


The Process

To achieve a cross-functional understanding of the user, the following methods and approaches were utilized:

  • Qualitative & Quantitative Research: Mixed-method surveys and in-depth user interviews segmented by income clusters (Varejo, Prime, Alta Renda).

  • Data Analysis: Crossing qualitative behavioral insights with quantitative data from Google Analytics and Data Studio.

  • Social Listening / External Complaint Analysis: Evaluating spontaneous feedback from platforms like Reclame Aqui.

  • Bug Tracking & Technical Mapping: Partnering with engineering teams to map app crashes, delays, and friction points.

  • Market Benchmark: Utilizing BAIN reports to compare NPS and product principality against competitors.

The research process was structured to dismantle organizational silos by integrating quantitative metrics with deep qualitative insights. To achieve a comprehensive understanding of the user journey, the methodology was executed through interconnected phases:


Deep Dive into Banking Relationships & Financial Life

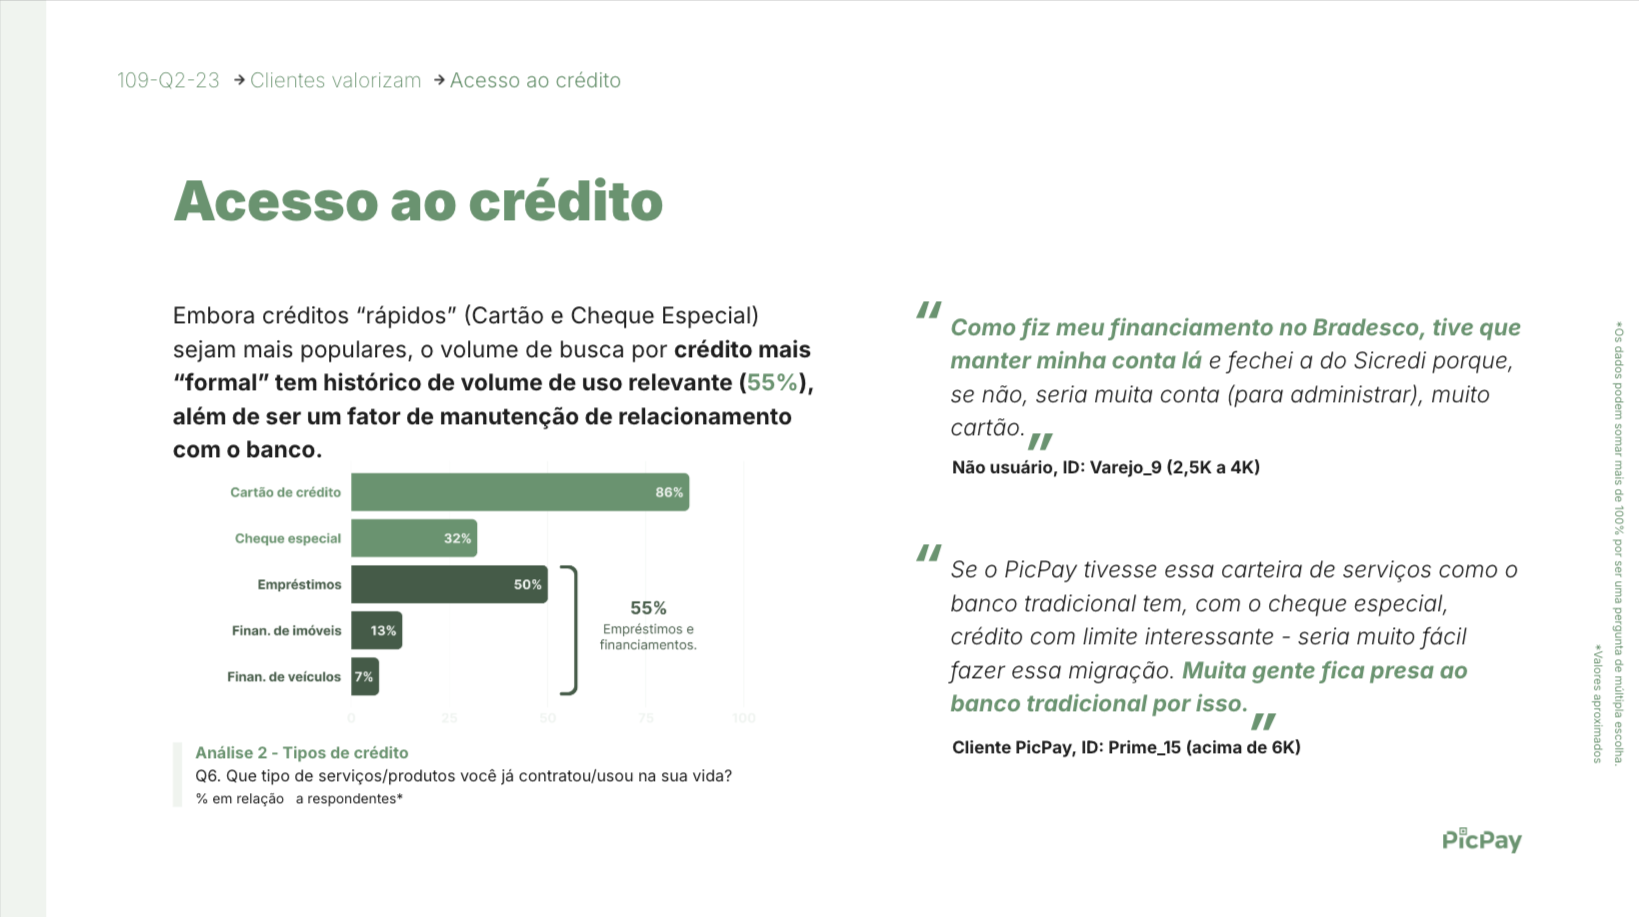
We initiated the project by mapping the core drivers of user retention and churn. Through a mixed-methods approach, the team conducted 34 in-depth qualitative interviews and surveyed 950 users, carefully segmenting the data across specific income clusters (Retail, Prime, and High-Income). This foundational step was vital to uncovering what customers truly value and pinpointing their primary friction points. The investigation revealed a critical insight: across all income tiers, the lack of access to credit—rather than fees or general app usability—was the definitive leading cause of account abandonment.

Why it was done: To map what customers truly value (e.g., credit access, security, low-risk investments) and their primary pain points (e.g., high fees, poor UX, managing too many accounts). This helped identify that the lack of credit is the biggest driver for account abandonment across all income levels.

Experience Diagnosis and Technical Mapping

To accurately diagnose usability issues, we moved beyond standard surveys and cross-referenced external user complaints (from platforms like Reclame Aqui) with internal system stability data from Google Analytics and Data Studio.

By sitting down directly with engineering and tech teams, we mapped the exact points where the application experienced delays or crashes. The rationale was to separate perceived technical failures from actual system bugs. Surprisingly, the analysis demonstrated that many reported "bugs" were actually the result of human error, lack of transparency regarding fees, or rigid internal risk rules. For instance, this hands-on mapping uncovered a hidden flaw where users turning 18 were systemically blocked from accessing their accounts due to unmapped internal logic validations, costing the company potential active users.

Why it was done: To understand the real impact of "bugs" on the user experience. The analysis surprisingly revealed that many perceived bugs were actually human errors, lack of transparency regarding fees, or unmapped internal risk rules blocking the user.

High-Value Churn and LTV Reassessment

Simultaneously, we partnered with the Lifecycle team to investigate a noticeable drop in profitability among the "High-Value" user cluster. The objective was to determine why these highly profitable users seemed to be abandoning the platform. However, the qualitative behavioral layer proved that their relationship with PicPay actually remained very strong. The apparent "churn" was primarily driven by external income variations—such as the natural seasonality of informal workers' earnings—or internal actions, like abrupt credit limit reductions without proper communication. This phase was crucial as it fundamentally shifted the company's perspective, leading to a more accurate calculation of Lifetime Value (LTV) that accounted for seasonal income cycles instead of misdiagnosing them as churn.

Why it was done: To fix the misconception that these users were abandoning the brand. The data showed their relationship with PicPay remained strong, but their usage shifted due to external income variations or internal actions, like sudden credit limit cuts.

The "Research Showcase" and Insight Democratization

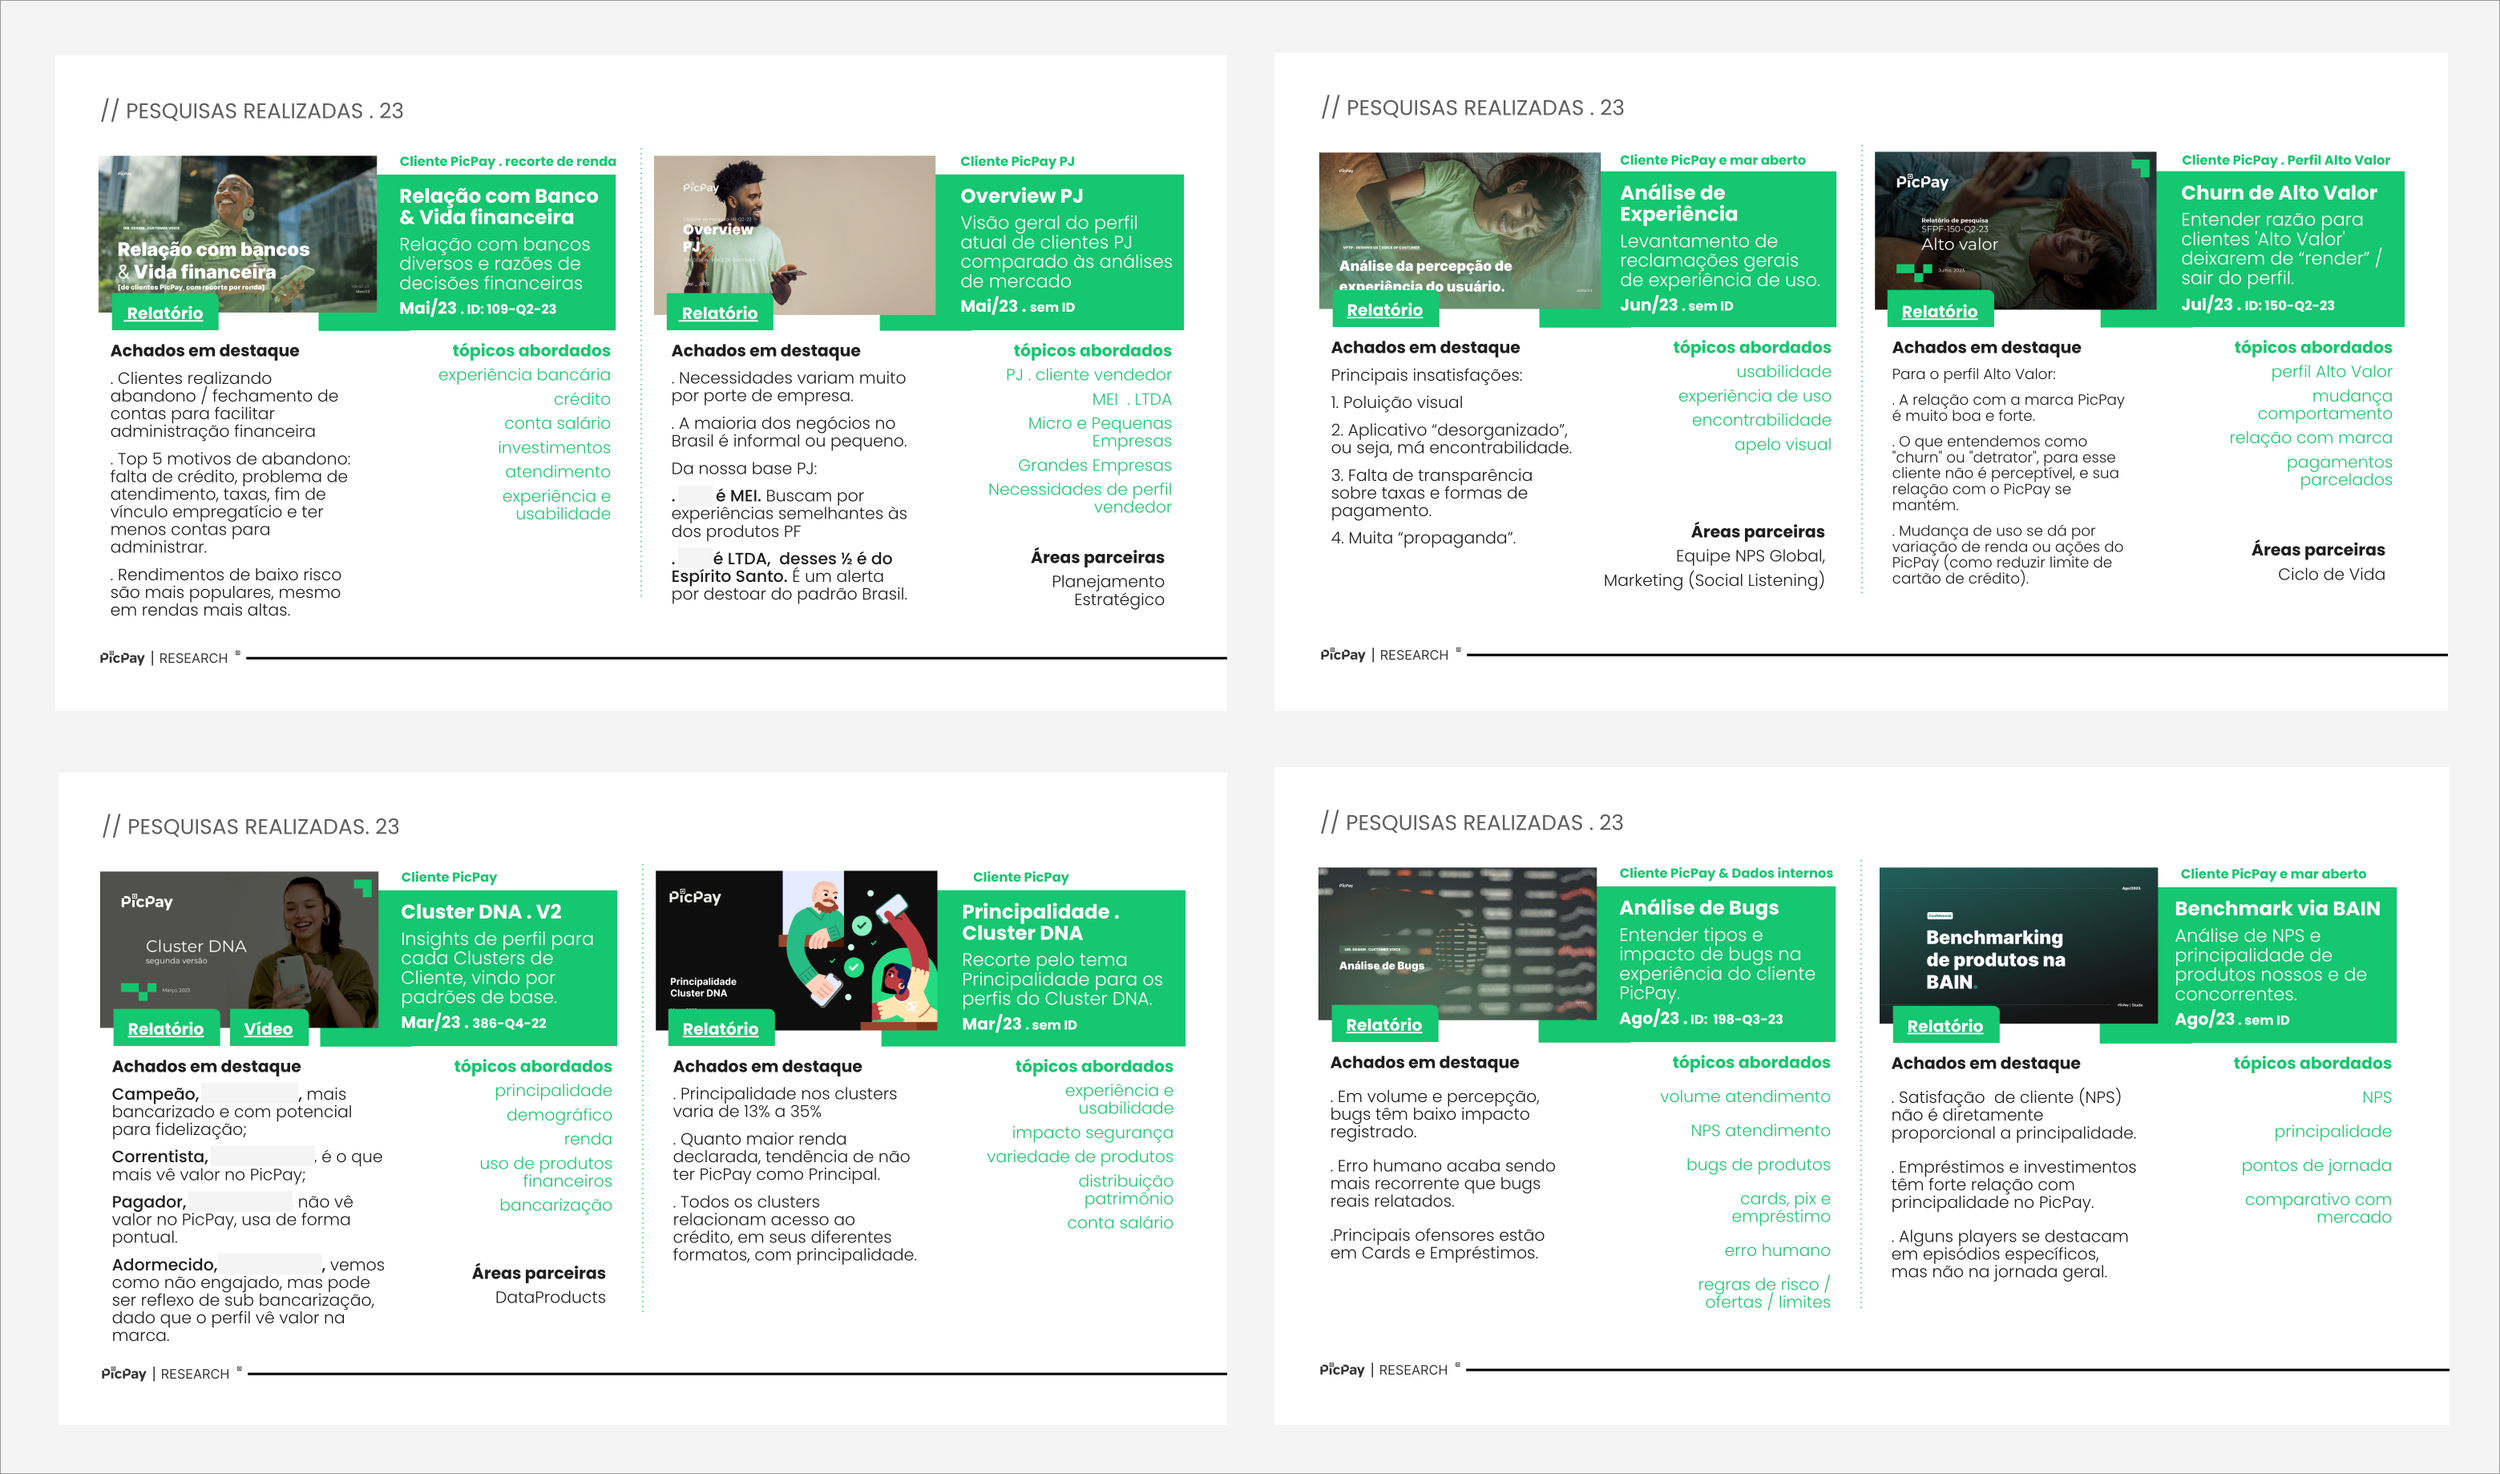
To ensure the findings drove actionable change across the company, we developed a "Research Showcase" (Vitrine).

Because the goal was to support multiple business units, we packaged the research into accessible, ongoing teaser presentations distributed directly to various squads—including DataProducts, Marketing, and Strategic Planning.

Why it was done: To break business silos. By continuously pushing cross-functional insights to different teams, we ensured that product, marketing, and tech teams were aligned on the same user behaviors.

SOME Results

  • Strategic Repositioning: The insights directly influenced the redefinition of product strategies and helped define the internal metrics for measuring "Principality".

  • Refined LTV (Lifetime Value) Reading: The qualitative layer helped data teams understand the seasonality of informal workers' income. Instead of viewing low-revenue months as "churn," the company learned to adjust its LTV calculations to account for seasonal sales cycles, preventing poor strategic decisions.

  • The Fatigue of Multiple Accounts (Product Opportunity) More than 15% (15.6%) of users abandon accounts due to a specific pain point: the desire to manage fewer accounts in order to avoid losing financial control. This validated the necessity and potential of centralizing products, such as the "Conta das Contas" (Account of Accounts), which aims to help users unify and simplify their financial lives.

  • UX vs. Fees Paradigm Shift: The research proved that poor app experience (47%) and security issues (53%) were viewed by users as more critical deterrents than high fees rates (40%).

  • Base Opportunity Mapping (Cluster DNA) The research team helped map and understand customer profiles, discovering that the largest segment of the user base (31%) consisted of "Dormant" (Adormecidos) clients. These are underbanked users who actually see significant value in the brand and possess high engagement potential. In contrast, the "Champions" (highly banked users with high loyalty potential) represented only 8% of the base.

  • Uncovering Blind Spots: The bug analysis identified a hidden demographic—users turning 18 who were being systemically blocked from the app due to unmapped logic validation errors, representing a missed opportunity for new user acquisition.

  • The Salary Account Paradox The data showed that while salary accounts represent a strong opportunity for initial attraction and relationship building, they alone do not guarantee user retention. Once the employment link ends, the relationship with the bank often ends as well, with the loss of an employment connection ranking among the Top 5 reasons (15.6%) for account closure or abandonment.

Collaboration and Stakeholders

The project was highly collaborative, acting as a bridge between the UX Research team and several key areas:

  • DataProducts: Collaborated on clustering DNA and identifying principality markers.

  • Lifecycle (Ciclo de Vida): Partnered to analyze High-Value user churn and behavioral shifts.

  • NPS Global & Marketing: Worked together on social listening and understanding external brand perception.

  • Strategic Planning (Planejamento Estratégico): Used the insights for PJ (Corporate/Business) overviews.

  • Tech/Engineering Teams: Collaborated directly to map bugs, app delays, and system crashes.


Viviane Delvequiopicpay